During the previous article I talked about how was quick and simple to make a small microservices architecture using Quarkus as Cloud Native Stack. I presented an example application and built it from scratch to deploy on Kubernetes. It was a very positive experience because Quarkus give to the developer a set of extensions and plugins that give the opportunity to use the fresher technology in a very productively way making easy the developer’s life.
In this article I want to extend the application exploring other useful Quarkus extensions. When we work with distributed systems and mainly with microservices we have a quantity of deployments spread in the on-promises, cloud or hybrid network. This scenario give us the opportunity to elastically react to load changes, implement high availability and optimize our costs. But this makes the architecture more complex because in general we couldn’t know how many instance of a service are running in a determined moment and where these services are running. Some of these services could become unhealthy and we would like to react replacing unhealthy instances with a new one. Another important aspect is the readiness of the service because these services could dynamically start up and shutdown and typically the startup isn’t instantaneous. It becomes important to understand if the service is “ready” to work. Healthiness and Readiness are very important when we install our applications inside an orchestrator like Kubernetes because it uses this information to manage the workloads. We could also be interested on custom metrics to have information and statistics about time elapsed or number of invocations. Metrics are very useful to monitor performance, predict bad trends, tune components and solve bottlenecks. For the same reason, collect metrics is complicated in a dynamic environment because the number of service and the address and port of them change continuously.
From the developer point of view, these are common problems for this reason there are standard that address it. The Eclipse MicroProfile project defines MicroProfile Metrics and Health specifications that are implemented in Quarkus. For more information about MicroProfile visit the web site: microprofile.io.
To give a complete understanding of what kind of advantages gives to apply to solid standard to monitor metrics I will show also how this metrics can be practically collected by a Prometheus application inside Kubernetes and graphically shown by Grafana.
Last but not least, we will quickly add a database to our services using Quarkus extensions adding to the application also the persistence layer.
To download the complete source code of this article clone the following repository: https://github.com/marcelloraffaele/starevent-quarkus/tree/b1.1-monitoring
The architecture
The application is a simplified version of an event booking system. Our customers want to book tickets for available concert. The frontend of our application must be available 24/7 and must quickly react to failures. In addition we want to monitor the application and send notification using Prometheus and create daily reports on traffic and resource usage statistics using Grafana.
The desired architecture is the following:
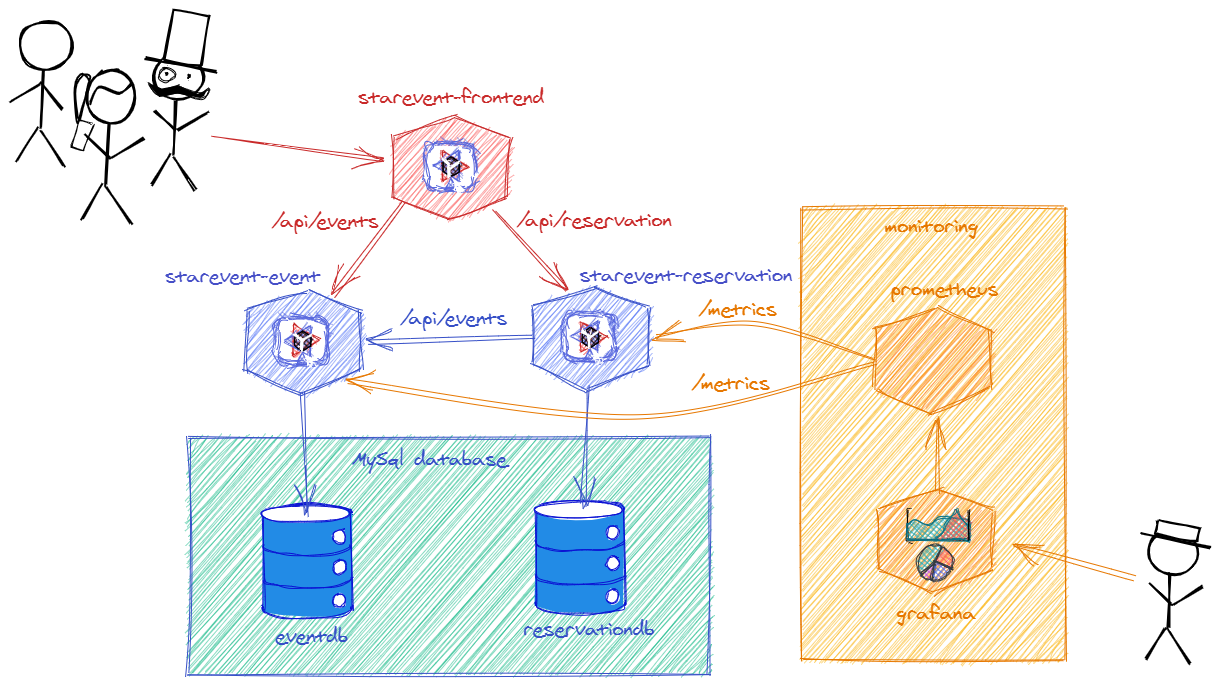
Notice that is needed also two databases one for event and another for reservation.
MicroProfile Health Check specification
The MicroProfile Health Check specification defines a single container runtime mechanism for validating the availability and status of a MicroProfile implementation. Health checks are used to determine if a computing node needs to be discarded (terminated, shutdown) and eventually replaced by another (healthy) instance. The MicroProfile Health Check consists of two /health/ready and /health/live endpoints that respectively represent the readiness and the liveness of the entire runtime. The specification simplified the developer work because it is only necessary to:
- Create an implementation of HealthCheck functional interface
- Annotate the code with: @Liveness for health check or @Readiness readiness check.
To enable the health check inside the project is needed to add the smallrye-health quarkus extension inside the pom.xml:
<!-- complete source code at https://github.com/marcelloraffaele/starevent-quarkus/blob/b1.1-monitoring/starevent-event/pom.xml -->
<dependency>
    <groupId>io.quarkus</groupId>
    <artifactId>quarkus-smallrye-health</artifactId>
</dependency>
And implement the Health check components for liveness:
//complete source code at https://github.com/marcelloraffaele/starevent-quarkus/blob/b1.1-monitoring/starevent-event/src/main/java/com/rmarcello/starevent/health/PingEventResourceHealthCheck.java
@Liveness
@ApplicationScoped
public class PingEventResourceHealthCheck implements HealthCheck {

    @Inject
    EventResource er;

    @Override
    public HealthCheckResponse call() {
        er.ping();
        return HealthCheckResponse.named("Ping Event REST Endpoint").up().build();
    }

}
And for readiness:
//complete source code at https://github.com/marcelloraffaele/starevent-quarkus/blob/b1.1-monitoring/starevent-event/src/main/java/com/rmarcello/starevent/health/DatabaseConnectionHealthCheck.java
@Readiness
@ApplicationScoped
public class DatabaseConnectionHealthCheck implements HealthCheck {

    @Inject
    EventService eventService;

    @Override
    public HealthCheckResponse call() {
        HealthCheckResponseBuilder responseBuilder = HealthCheckResponse.named("Event Datasource connection health check");
        try {
            long cnt = eventService.countEvents();
            responseBuilder.withData("Number of events in the database", cnt).up();
        } catch (IllegalStateException e) {
            responseBuilder.down();
        }
        return responseBuilder.build();
    }
}
Notice that for readiness, I decided to implement a query on the database that only if successful will consider the service ready.
If we want to verify if health checks are working, we can run the application and invoke HTTP GET request on /health/ready and /health/live endpoints:
### get live
curl -X GET "http://localhost:8081/health/live"
#answer
{
  "status": "UP",
  "checks": [
    {
      "name": "Ping Event REST Endpoint",
      "status": "UP"
    }
  ]
}

### get ready
curl -X GET "http://localhost:8081/health/ready"
#answer
{
  "status": "UP",
  "checks": [
    {
      "name": "Database connections health check",
      "status": "UP"
    },
    {
      "name": "Event Datasource connection health check",
      "status": "UP",
      "data": {
        "Number of events in the database": 6
      }
    }
  ]
}
Later in the article I will show how to use these endpoints to implement Kubernetes Liveness and Readiness Probes.
MicroProfile Metrics
Reliable service of a platform needs monitoring and the MicroProfile Metrics specification defines a standard with respect to (base) API path, data types involved, always available metrics and return codes used. Metrics are different from health checks. Health check are primarily targets at quick yes/no response. Metrics can help to determine the level of health of a service and provide long term trend data for capacity planning and pro-active discovery of issues. Metrics can also help to schedule systems to decide when to scale the application to run on more or fewer machines. The MicroProfile Metrics specification defines three kinds of metrics:
- base: metrics that all MicroProfile vendors have to provide. Are exposed under /metrics/base.
- vendor: vendor specific metrics (optional). Each implementation can define own specific metrics on top of the basic set of required metrics. Are exposed under /metrics/vendor.
- application: application-specific metrics (optional). The developer can implement the own metrics using the API. Application specific metrics are exposed under /metrics/application.
MicroProfile Metrics provides a way to register Application-specific metrics to allow applications to expose metrics in the application scope. The metrics registration can be done using annotations or programmatically to create new metrics dynamically at runtime. There are different type of Annotation that can be used, here is the list of the main ones:
- @Counted: Denotes a counter, which counts the invocations of the annotated object.
- @Gauge: Denotes a gauge, which samples the value of the annotated object.
- @Metered: Denotes a meter, which tracks the frequency of invocations of the annotated object.
- @Timed: Denotes a timer, which tracks duration of the annotated object.
For the full list see the documentation at: microprofile-metrics-spec-2.3
To add custom metrics on our project, we need to add the metrics extension:
<!-- complete source code at https://github.com/marcelloraffaele/starevent-quarkus/blob/b1.1-monitoring/starevent-event/pom.xml -->
<dependency>
    <groupId>io.quarkus</groupId>
    <artifactId>quarkus-smallrye-metrics</artifactId>
</dependency>
Using this dependency we can add annotations on the resource methods to implement desired metrics:
//complete source code at https://github.com/marcelloraffaele/starevent-quarkus/blob/b1.1-monitoring/starevent-event/src/main/java/com/rmarcello/starevent/service/EventService.java
@Produces(MediaType.APPLICATION_JSON)
@Consumes(MediaType.APPLICATION_JSON)
@Path("/api/events")
public class EventResource {

    @Inject
    EventService service;

    @Timed(name = "EventResource_timeAllEvent", absolute = true, description = "Times how long it takes to invoke the all Event method", unit = MetricUnits.MILLISECONDS)
    @GET
    public Response allEvent() {
        List<Event> allEvents = service.getAllActiveEvents();
        return Response.ok(allEvents).build();
    }

    @Counted(name = "EventResource_countDeleteEvent", absolute = true, description = "Counts how many times the deleteEvent method has been invoked")
    @DELETE
    @Path("/{id}")
    public Response deleteEvent(@Parameter(description = "Event id", required = true) @PathParam("id") Long id ) {
        service.deleteEvent(id);
        LOGGER.debug("Event deleted: " + id);
        return Response.noContent().build();
    }
Notice that @Counted annotation is the simplest one and monitor only the invocations count. The @Timed annotation is the most complete, it works also as counter.
To see the result of this quick implementation we can run the application and run:
#get all metrics
curl -X GET "http://localhost:8081/metrics" -H  "accept: application/json"
#answer
{
  "base": {
    "gc.total;name=Copy": 20,
    "gc.total;name=MarkSweepCompact": 2,
    "cpu.systemLoadAverage": 1.5,
    "gc.time;name=Copy": 278,
    "thread.count": 42,
    ...
  },
  "vendor": {
    "memory.freePhysicalSize": 6404702208,
    "memoryPool.usage.max;name=CodeHeap 'non-profiled nmethods'": 2799232,
    "memoryPool.usage;name=Metaspace": 51056800,
    "memoryPool.usage;name=Tenured Gen": 13964000,
    ...
  },
  "application": {
    "EventResource_countDeleteEvent": 3,
    "EventResource_timeAllEvent": {
      "p99": 538.9594,
      "min": 13.6616,
      "max": 538.9594,
      "mean": 137.45756443553387,
      "p50": 38.9639,
      "p999": 538.9594,
      "stddev": 165.22453726192603,
      "p95": 538.9594,
      "p98": 538.9594,
      "p75": 225.3533,
      "fiveMinRate": 0.04161909302302286,
      "fifteenMinRate": 0.014251336875726597,
      "meanRate": 0.003014269454864466,
      "count": 13,
      "oneMinRate": 0.17714679831384386
    },
    ...
  }
}

# if you are interested only on application metrics
curl -X GET "http://localhost:8081/metrics/application" -H  "accept: application/json"
#answer
{
  "EventResource_countDeleteEvent": 3,
  "EventResource_timeAllEvent": {
    "p99": 538.9594,
    "min": 13.6616,
    "max": 538.9594,
    "mean": 137.45756443553387,
    "p50": 38.9639,
    "p999": 538.9594,
    "stddev": 165.22453726192603,
    "p95": 538.9594,
    "p98": 538.9594,
    "p75": 225.3533,
    "fiveMinRate": 0.03295772552533173,
    "fifteenMinRate": 0.013184909295049382,
    "meanRate": 0.0029660679746088213,
    "count": 13,
    "oneMinRate": 0.05516408410108005
  },
 ...
Ok it was easy to build these metrics but now what I can do with this data? The power of use a standard is that we talk a language that everyone that adhere to the same standard can understand. There are open source projects that understand this metric format and can collect it. Let’s talk about Prometheus and Grafana.
Prometheus and Grafana
Prometheus is an open-source systems monitoring and alerting toolkit. Many companies and organizations have adopted Prometheus, and the project has a very active developer and user community. It is now a standalone open source project and maintained independently of any company.
Prometheus’s main features are:
- a multi-dimensional data model with time series data identified by metric name and key/value pairs
- PromQL, a flexible query language to leverage this dimensionality
- time series collection happens via a pull model over HTTP or in a push model using gateways
- targets are discovered via service discovery or static configuration.
In practice Prometheus can discover our service and collect time series of metrics. We can configure Prometheus jobs defining “scrapes” metrics, either directly or via an intermediary push gateway for short-lived jobs. It stores all scraped samples locally and runs rules over this data to either aggregate and record new time series from existing data or generate alerts. Prometheus has minimal UI that can be used to query data and create basic graphs. Grafana or other API consumers can be used to visualize the collected data.
Grafana is open source visualization and analytics software. It allows you to query, visualize, alert on, and explore your metrics no matter where they are stored. Grafana includes built-in support for Prometheus. It is possible to create a Grafana data source that connect to Prometheus and give the possibility to continuously query its data.
This article shows the basic configuration of Prometheus and Grafana in order to show how it can extract important information from our MicroProfile metrics.
Prometheus configuration
If we need a basic configuration for Prometheus, it is necessary to define a prometheus.yml file and specify the scrape interval and job definitions. The following example defines a job for each “startevent” services:
#complete source code at https://github.com/marcelloraffaele/starevent-quarkus/blob/b1.1-monitoring/docker/monitoring/prometheus.yml
global:
  scrape_interval:     10s
scrape_configs:
  - job_name: 'prometheus'
    static_configs:
      - targets: ['starevent-prometheus:9090']
  - job_name: 'starevent-event'
    static_configs:
      - targets: ['starevent-event:8081']
  - job_name: 'starevent-reservation'
    static_configs:
      - targets: ['starevent-reservation:8082']
Prometheus’s configurations are very powerful and inside a Kuberetes environment it can retrieve scrape targets from Kubernetes REST API and always staying synchronized with the cluster state.
Here is the example for prometheus.yml that will be used later with Kubernetes:
#complete source code at https://github.com/marcelloraffaele/starevent-quarkus/blob/b1.1-monitoring/kubernetes/monitoring.yaml
global:
  scrape_interval:     10s
scrape_configs:
  - job_name: 'starevent-pods'
    kubernetes_sd_configs:
    - role: pod
    relabel_configs:
      - source_labels: [__meta_kubernetes_pod_annotation_prometheus_io_scrape]
        action: keep
        regex: true
      - source_labels: [__meta_kubernetes_pod_name]
        action: replace
        target_label: kubernetes_pod_name
      - source_labels: [__meta_kubernetes_pod_label_app_kubernetes_io_name]
        action: replace
        target_label: app_kubernetes_io_name
      - source_labels: [__meta_kubernetes_pod_label_app_kubernetes_io_version]
        action: replace
        target_label: app_kubernetes_io_version
Notice that Prometheus give also the possibility to extract labels and annotations information from kubernetes object that can be used inside metrics.
Grafana configuration
A basic Grafana configuration is composed of a data source and dashboard. It has also a good and quick UI and is possible to create this configuration ex-novo. Anyway for this example I decided to define a prepared data source that read from Prometheus endpoint:
#complete source code at https://github.com/marcelloraffaele/starevent-quarkus/blob/b1.1-monitoring/docker/monitoring/grafana-ds.yaml
apiVersion: 1
deleteDatasources:
  - name: Prometheus
    orgId: 1
datasources:
  - name: Prometheus
    type: prometheus
    access: proxy
    orgId: 1
    url: http://prometheus:9090
In practice it defines data source type (Prometheus), the hostname and port of Prometheus service.
If you are interested on a prepared dashboard, see it from this link grafana-dashboard.json.
Integration with the Database
First we need to consider that every microservice should have an own database to avoid dependency from other microservices. For this reason I will create only one instance of MySQL engine and two different database inside:
- eventdb: the database for the Event Microservice
- reservationdb: the database for the Reservation Microservice
Database creation
To create the database and initialize its structure, it is possible to execute a prepared SQL script after the database creation or to configure the application to update/create the database structure as needed. Personally I don’t like to leave the application the possibility to change the database structure but I prefer to have the full control on it. For this reason I created a script that initialize the database structure and must be launched after database creation.
--complete source code at https://github.com/marcelloraffaele/starevent-quarkus/blob/b1.1-monitoring/docker/dbinit/1_ddl.sql
CREATE DATABASE eventdb;

CREATE USER 'eventdb' IDENTIFIED BY 'CHANGETHISPASSWORD';
GRANT ALL PRIVILEGES ON eventdb.* TO 'eventdb';
FLUSH PRIVILEGES;

USE eventdb;

DROP TABLE IF EXISTS `event`;
CREATE TABLE `event` (
  `id` bigint NOT NULL AUTO_INCREMENT,
  `title` varchar(200) NOT NULL,
  `artist` varchar(100) DEFAULT NULL,
  `description` varchar(500) DEFAULT NULL,
  `start_date` datetime DEFAULT NULL,
  `location` varchar(200) DEFAULT NULL,
  `address` varchar(200) DEFAULT NULL,
  `price` float NOT NULL,
  `availability` int NOT NULL,
  `img` varchar(500) DEFAULT NULL,
  PRIMARY KEY (`id`)
) ENGINE=InnoDB DEFAULT CHARSET=utf8mb4 COLLATE=utf8mb4_0900_ai_ci;
-- ...
Quarkus database integration
There are two main way to implement JPA in Quarkus. One is the classic JPA using Hibernate. The second is to use Panache that extends Hibernate to provide new interesting pattern for data access that we will see later. In the course of this article I will show the Hibernate extension with panache. For this reason we need to add the Panache extension and MySQL library to the pom.xml:
<!-- complete source code at https://github.com/marcelloraffaele/starevent-quarkus/blob/b1.1-monitoring/starevent-event/pom.xml -->
<dependency>
    <groupId>io.quarkus</groupId>
    <artifactId>quarkus-hibernate-orm-panache</artifactId>
</dependency>
<dependency>
    <groupId>io.quarkus</groupId>
    <artifactId>quarkus-jdbc-mysql</artifactId>
</dependency>
Now that we have the libraries, we need to specify some properties to configure the database interaction. To do this, add to the application.properties file the following lines:
#complete source code at https://github.com/marcelloraffaele/starevent-quarkus/blob/b1.1-monitoring/starevent-event/src/main/resources/application.properties
#database
quarkus.datasource.db-kind=mysql
quarkus.datasource.username=eventdb
quarkus.datasource.password=CHANGETHISPASSWORD
quarkus.datasource.jdbc.url=jdbc:mysql://localhost:3306/eventdb
quarkus.hibernate-orm.database.generation=none
Notice that quarkus.hibernate-orm.database.generation=none means that I don’t want automatic database generation.
The Panache library offers both the classical “repository pattern” and the “active record pattern”.
Repository pattern
The repository pattern is a classic, we need to create the repository class that implements the PanacheRepository interface that will automatically give a set of already implemented methods to find, list, stream, count, delete, persist and update entity objects. The following fragment of code shows a practical example inside the EventRepository.class:
//complete source code at https://github.com/marcelloraffaele/starevent-quarkus/blob/b1.1-monitoring/starevent-event/src/main/java/com/rmarcello/starevent/repository/EventRepository.java
import io.quarkus.hibernate.orm.panache.PanacheRepository;

@ApplicationScoped
public class EventRepository implements PanacheRepository<Event> {

	public List<Event> listAvailableEvents(LocalDateTime now) {
        List<Event> l = this.list("availability > 0 and startDate > ?1", now);
		return l;
	}

	public Event findRandom() {
        long count = this.count();
        int randomPage = new Random().nextInt((int) count);
        return this.findAll().page(randomPage, 1).firstResult();
	}

}
Notice that if the default methods aren’t enough we can implement other methods using the existing as I did for listAvailableEvents and findRandom. It is possible to inject the repository inside our EventService and use it directly:
//complete source code at https://github.com/marcelloraffaele/starevent-quarkus/blob/b1.1-monitoring/starevent-event/src/main/java/com/rmarcello/starevent/service/EventService.java
@ApplicationScoped
@Transactional(Transactional.TxType.REQUIRED)
public class EventService {

	@Inject EventRepository eventRepository;

	@Transactional(Transactional.TxType.SUPPORTS)
	public List<Event> getAllActiveEvents() {
        final LocalDateTime now = LocalDateTime.now();
        List<Event> eventList = eventRepository.listAvailableEvents(now);
		return eventList;
	}

	@Transactional(Transactional.TxType.SUPPORTS)
	public Optional<Event> getEventById(Long id) {
		return eventRepository.findByIdOptional( id );
	}

	@Transactional(Transactional.TxType.SUPPORTS)
	public Event getRandomEvent() {
		return eventRepository.findRandom();

	}

    public @Valid Event persistEvent(@Valid Event event) {
		eventRepository.persist(event);
		return event;
	}
    //...
}
Using the @Transactional annotation is possible to define the transaction management of this methods. Here by default was choosen Transactional.TxType.REQUIRED and for reads Transactional.TxType.SUPPORTS.
Active record pattern
The active record pattern wants to simplify the developer life making the code more readable and clear. This pattern proposes to write only the code that is needed and take advantage of the Panache Library. We create the entity class and extends PanacheEntity. Successively is needed to declare the fields as public adding JPA annotation where needed. If the default methods that PanacheEntityBase abstract class define aren’t enough we can implement other utility methods ( see the getAllByUserId method ). Here’s an example:
//complete source code at https://github.com/marcelloraffaele/starevent-quarkus/blob/b1.1-monitoring/starevent-reservation/src/main/java/com/rmarcello/starevent/model/Reservation.java
@Entity
@Table(name="reservation")
public class Reservation extends PanacheEntityBase {

    @Id
    @GeneratedValue(strategy = GenerationType.IDENTITY)
    @Column(name = "id", updatable = false, nullable = false)
    @Min(0)
    public Long id;

    @NotNull
    @Column(name = "event_id")
    public Long eventId;

    @NotNull
    @Column(name = "user_id")
    public String userId;

    @NotNull
    @Column(name = "secure_code")
    public String secureCode;

    @NotNull
    public LocalDateTime date;

    public static List<Reservation> getAllByUserId(String userId) {
        return list("userId=?1", userId);
    }

    //...
}
Once the entity has been created, we can access the data directly by invoking the static methods made available by panache:
//complete source code at https://github.com/marcelloraffaele/starevent-quarkus/blob/b1.1-monitoring/starevent-reservation/src/main/java/com/rmarcello/starevent/services/ReservationService.java
@ApplicationScoped
@Transactional(Transactional.TxType.REQUIRED)
public class ReservationService {

    private final static Logger LOGGER = Logger.getLogger(ReservationService.class);

    @Inject
    @RestClient
    EventsProxy eventClient;

    @Transactional(Transactional.TxType.SUPPORTS)
	public Optional<Reservation> getReservationById(Long id) {
        return Reservation.findByIdOptional(id);
    }

    @Transactional(Transactional.TxType.SUPPORTS)
	public List<Reservation> getAllByUserId(String userId) {
		return Reservation.getAllByUserId(userId);
	}

    @Transactional(Transactional.TxType.SUPPORTS)
	public List<Reservation> getAll() {
		return Reservation.listAll();
	}

    //..
}
It is difficult to say which model is better because they both solve the problem successfully. However, with the Active record pattern we can write less code, be fast and avoid creating additional classes for access. Furthermore, the code is clearer as all the code relating to accessing a table resides in a single class.
Let’s create a simplified Demo using Docker
I found very useful to iteratively create and test the architecture on my local machine using Docker. Starting from the database layer, I used docker to initialize and run a database that I used during development taking advantage of Quarkus “live coding”.
Docker gave me the opportunity to create/test/destroy the environment any time I wanted. Containers need few resources and I could have everything running locally on my computer.
To work with containers is essential to read the documentation on Docker Hub. For example at the mysql docker official image I understood how to configure a MySQL container, how to run a command line client, how to set up environment variables and initialize the database with custom sql scripts.
Before to start, remember that if you make changes to the source code, is needed to build the application images using the command:
mvn package -Dquarkus.container-image.build=trueAnd to push images to (your) remote repository.
Otherwise, you can use the images that I pushed as public on hub.docker.com.
When the docker images are ready it’s possibile to use the docker compose descriptor that I prepared to run a minimal set of containers to implement the architecture:
#complete source code at https://github.com/marcelloraffaele/starevent-quarkus/blob/b1.1-monitoring/docker/docker-compose.yaml
version: '3.1'
services:
  starevent-db:
    container_name: "starevent-db"
    image: mysql:8.0.22
    command: --default-authentication-plugin=mysql_native_password
    restart: always
    ports:
      - 3306:3306
    environment:
      MYSQL_RANDOM_ROOT_PASSWORD: "true"
    volumes:
      - ./dbinit/:/docker-entrypoint-initdb.d/
  starevent-event:
    image: "rmarcello/starevent-event:1.1-monitoring"
    container_name: "starevent-event"
    ports:
      - "8081:8081"
    environment:
      - QUARKUS_DATASOURCE_PASSWORD=password
      - QUARKUS_DATASOURCE_JDBC_URL=jdbc:mysql://starevent-db:3306/eventdb
    depends_on:
      - starevent-db
  starevent-reservation:
    image: "rmarcello/starevent-reservation:1.1-monitoring"
    container_name: "starevent-reservation"
    ports:
      - "8082:8082"
    environment:
      - COM_RMARCELLO_STAREVENT_CLIENT_EVENTSPROXY_MP_REST_URL=http://starevent-event:8081
      - QUARKUS_DATASOURCE_PASSWORD=password
      - QUARKUS_DATASOURCE_JDBC_URL=jdbc:mysql://starevent-db:3306/reservationdb
    depends_on:
      - starevent-event
  starevent-frontend:
    image: "rmarcello/starevent-frontend:1.1-monitoring"
    container_name: "starevent-frontend"
    ports:
      - "8080:8080"
    depends_on:
      - starevent-event
      - starevent-reservation
    environment:
      - COM_RMARCELLO_STAREVENT_CLIENT_EVENT_EVENTSPROXY_MP_REST_URL=http://starevent-event:8081
      - COM_RMARCELLO_STAREVENT_CLIENT_RESERVATION_RESERVATIONPROXY_MP_REST_URL=http://starevent-reservation:8082
  #moitoring
  starevent-prometheus:
    container_name: "starevent-prometheus"
    image: "prom/prometheus:v2.21.0"
    ports:
      - 9090:9090
    volumes:
      - ./monitoring/prometheus.yml:/etc/prometheus/prometheus.yml
    depends_on:
      - starevent-event
      - starevent-reservation
  starevent-grafana:
    container_name: "starevent-grafana"
    image: grafana/grafana
    ports:
      - 3000:3000
    volumes:
      - ./monitoring/grafana-dashboard.yaml:/etc/grafana/provisioning/dashboards/dashboard.yaml
      - ./monitoring/grafana-ds.yaml:/etc/grafana/provisioning/datasources/datasource.yaml
      - ./monitoring/grafana-dashboard.json:/var/lib/grafana/dashboards/dashboard.json
    depends_on:
      - starevent-prometheus
Running this script:
docker-compose -f docker-compose.yaml up -d
Creating network "docker_default" with the default driver
Creating starevent-db ... done
Creating starevent-event ... done
Creating starevent-reservation ... done
Creating starevent-prometheus ... done
Creating starevent-frontend ... done
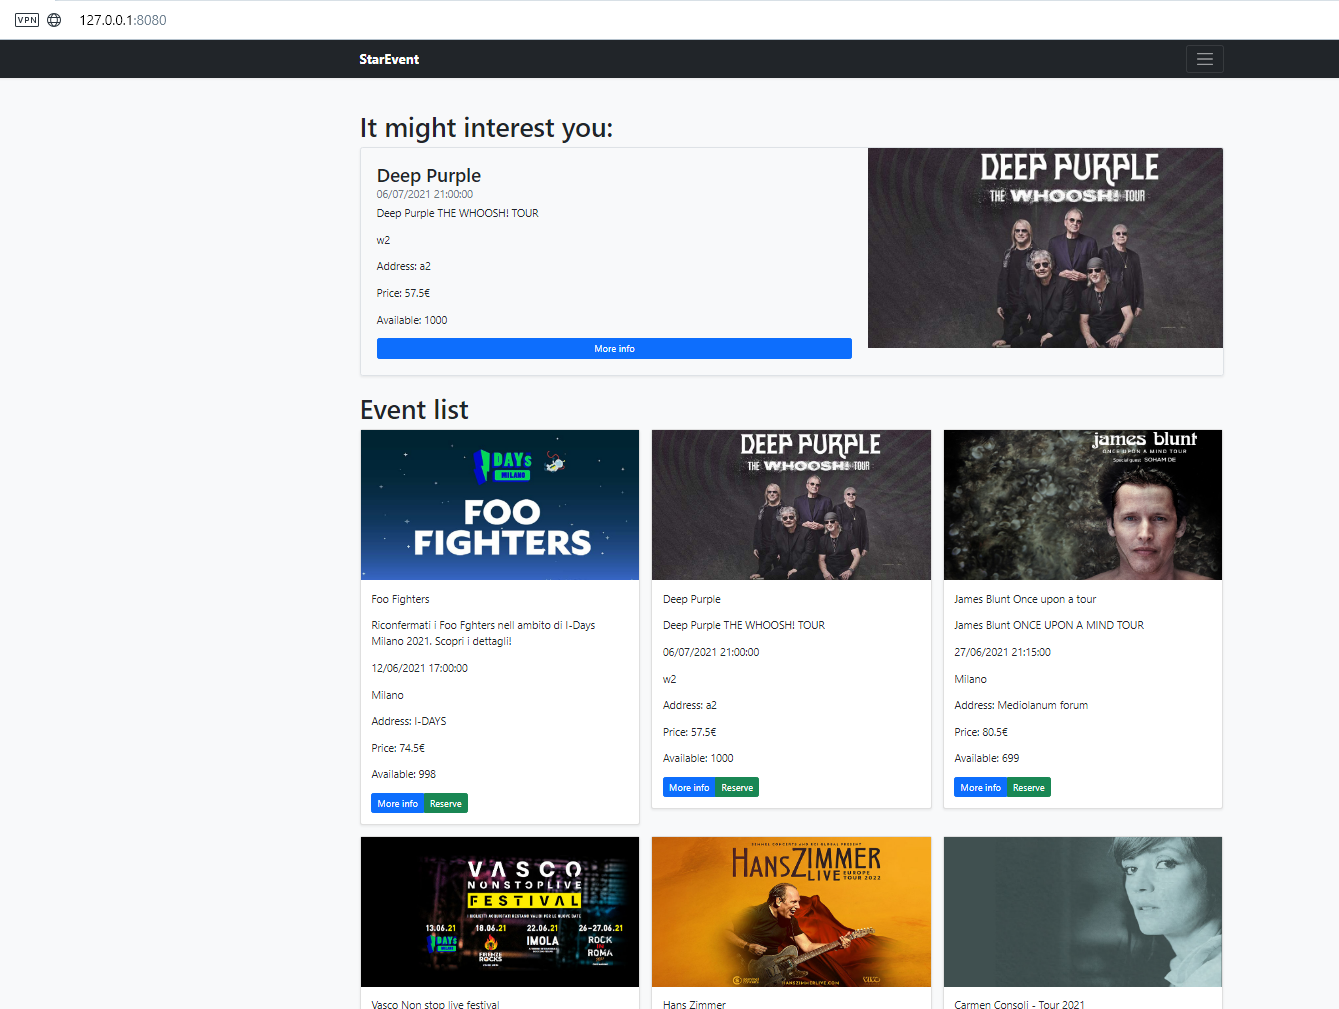
Creating starevent-grafana ... doneYou can see the frontend visiting http://127.0.0.1:8080:
You can see the Prometheus page visiting http://127.0.0.1:9090:
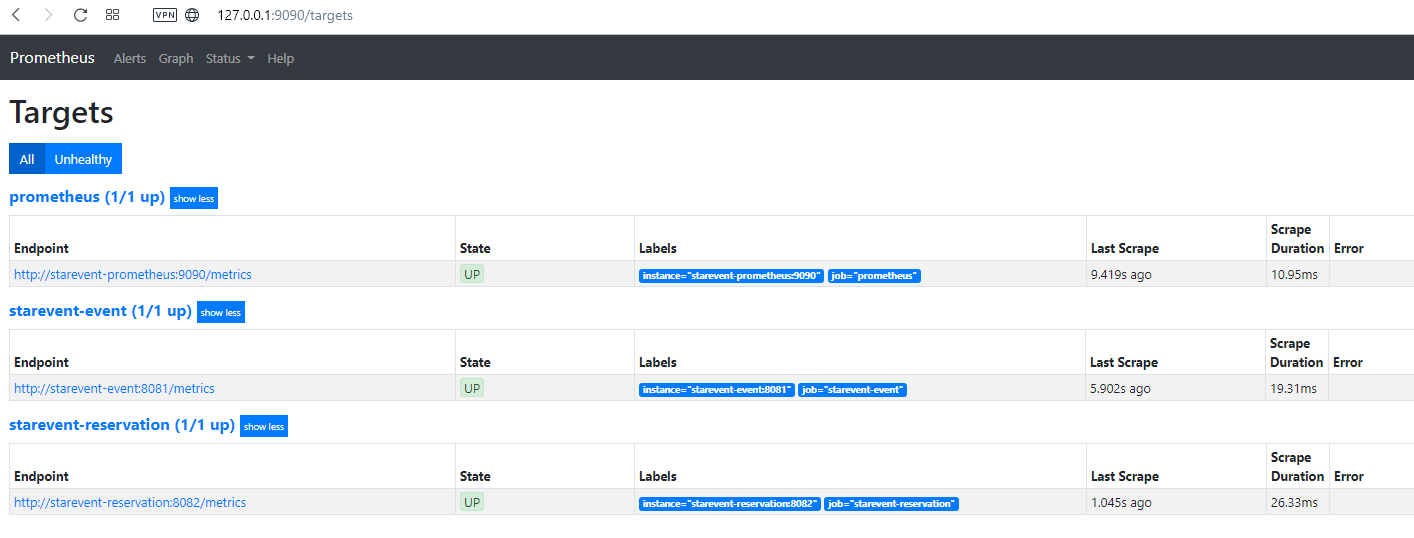
Notice as targets of the developed services.
You can see the Grafana page visiting http://127.0.0.1:3000 and set default user and password (admin/admin):
When we have finished our tests, we can clean up:
docker-compose -f docker-compose.yaml downPut all together into Kubernetes
To complete this article I need to show you how to bring everything on Kubernetes, how Prometheus dynamically adapt to the architectural changes and how we can take advantage of metrics using Grafana.
Using Kubernetes objects the architecture becomes something like this:
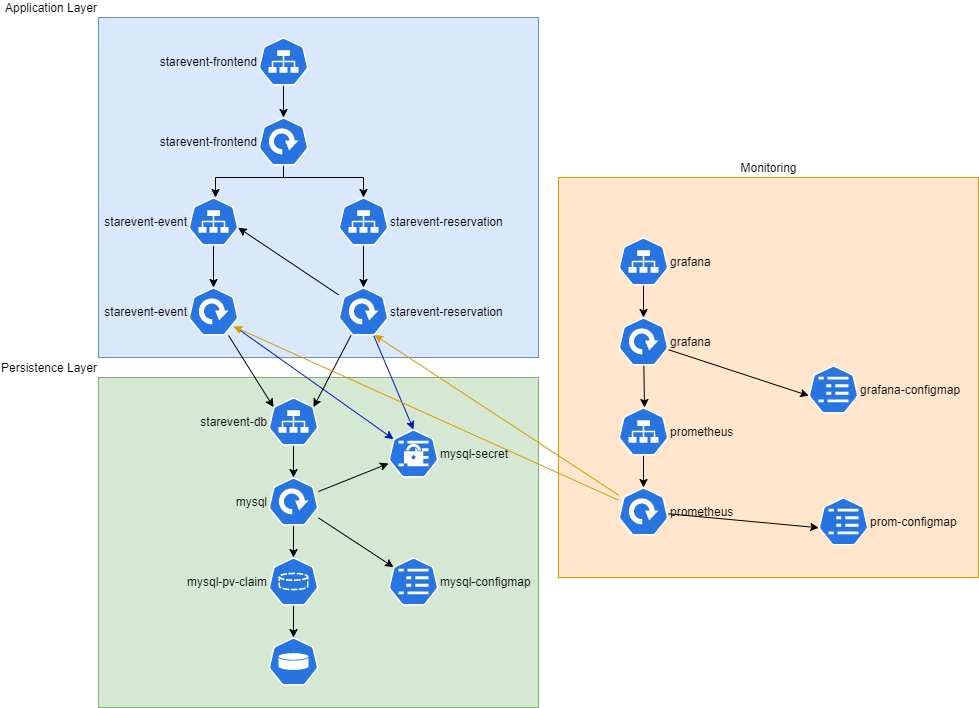
Now the architecture is a bit more complex than the original. Every service is run using deployment. In front of each deployment there’s a service that works like a load balancer. Wherever there’s need to store sensible information ( passwords ) I use secrets whereas use config maps for configurations.
Persistence Layer
During the last paragraph was presented a basic setup that can be very useful during development. The solution can be improved. It is possible to create a deployment to deploy a single replica for mysql database. The configuration of the database singleton pod is made using secrets to manage the database passwords and config map to keep the database initialization scripts. The following descriptor shows the database-config.yaml file:
#complete source code at https://github.com/marcelloraffaele/starevent-quarkus/blob/b1.1-monitoring/kubernetes/database-config.yaml
---
apiVersion: v1
kind: Secret
metadata:
  name: mysql-secret
  labels:
    project: mysql-test
type: Opaque
stringData:
  rootpassword: password
  eventdbpassword: eventdb
  reservationdbpassword: reservationdb
---
apiVersion: v1
kind: ConfigMap
metadata:
  name: mysql-configmap
  labels:
    project: mysql-test
data:
  init.sql: |
    CREATE DATABASE eventdb;
    #...
For a persistence layer, data persistence is crucial for this reason it’s needed to mount a persistent volume defining a persistent volume claim. The init.sql file is executed only at the first start of the container. Even if a restart occur, using the mounted persistent volume the container will understand that the database is already initialized and will restore data from the volume.
Notice that this solution is simple and cheap, but it is good only for test environment. If it’s needed to go in production I suggest using a more scalable and reliable solution. Most cloud provider offer database solution that can better address these problems and can be easily integrated into Kubernetes.
Application layer
For this task, we take advantage of the Quarkus Kubernetes extension that automatically creates the 99% of the kubernates.yaml file. It understands that we added health and metrics extensions to the project and adds in the Kubernetes descriptor:
- annotations that can be used by Prometheus to select the pod
- livenessProbe and readinessProbe already configured on the right endpoint and port
- service that simplify the connection with other applications.
Of course, we need to add to the kubernates.yaml file the environment variables with values from the database secrets. Here is a portion of the starevent-event application descriptor:
#complete source code at https://github.com/marcelloraffaele/starevent-quarkus/blob/b1.1-monitoring/kubernetes/application-event.yaml
apiVersion: apps/v1
kind: Deployment
metadata:
  annotations:
    prometheus.io/path: /metrics
    prometheus.io/port: "8081"
    app.quarkus.io/commit-id: 39a1f47d59290d86aed08d5dfde0ab5b8890ffcf
    app.quarkus.io/vcs-url: https://github.com/marcelloraffaele/starevent-quarkus.git
    app.quarkus.io/build-timestamp: 2021-01-10 - 21:45:45 +0000
    prometheus.io/scrape: "true"
  labels:
    app.kubernetes.io/name: starevent-event
    app.kubernetes.io/version: 1.1-monitoring
  name: starevent-event
spec:
  replicas: 1
  selector:
    matchLabels:
      app.kubernetes.io/name: starevent-event
      app.kubernetes.io/version: 1.1-monitoring
  template:
    metadata:
      annotations:
        prometheus.io/path: /metrics
        prometheus.io/port: "8081"
        app.quarkus.io/commit-id: 39a1f47d59290d86aed08d5dfde0ab5b8890ffcf
        app.quarkus.io/vcs-url: https://github.com/marcelloraffaele/starevent-quarkus.git
        app.quarkus.io/build-timestamp: 2021-01-10 - 21:45:45 +0000
        prometheus.io/scrape: "true"
      labels:
        app.kubernetes.io/name: starevent-event
        app.kubernetes.io/version: 1.1-monitoring
    spec:
      containers:
      - env:
        - name: KUBERNETES_NAMESPACE
          valueFrom:
            fieldRef:
              fieldPath: metadata.namespace
        - name: QUARKUS_DATASOURCE_PASSWORD
          valueFrom:
            secretKeyRef:
              name: mysql-secret
              key: eventdbpassword
        - name: QUARKUS_DATASOURCE_JDBC_URL
          value: jdbc:mysql://starevent-db:3306/eventdb
        image: rmarcello/starevent-event:1.1-monitoring
        imagePullPolicy: Always
        livenessProbe:
          failureThreshold: 3
          httpGet:
            path: /health/live
            port: 8081
            scheme: HTTP
          initialDelaySeconds: 0
          periodSeconds: 30
          successThreshold: 1
          timeoutSeconds: 10
        name: starevent-event
        ports:
        - containerPort: 8081
          name: http
          protocol: TCP
        readinessProbe:
          failureThreshold: 3
          httpGet:
            path: /health/ready
            port: 8081
            scheme: HTTP
          initialDelaySeconds: 0
          periodSeconds: 30
          successThreshold: 1
          timeoutSeconds: 10
Monitoring layer
For this layer I defined a config map for the Prometheus and Grafana configurations. The configuration is a translation of docker-compose monitor definition to kubernetes. Here the magic work is made by the Prometheus configuration that stay synchronized with the cluster state.
#complete source code at https://github.com/marcelloraffaele/starevent-quarkus/blob/b1.1-monitoring/kubernetes/monitoring.yaml
apiVersion: apps/v1
kind: Deployment
metadata:
  name: prometheus
  labels:
    app: prometheus
    project: starevent
spec:
  replicas: 1
  selector:
    matchLabels:
      app: prometheus
  template:
    metadata:
      labels:
        app: prometheus
        project: starevent
    spec:
      containers:
      - name: prometheus
        image: prom/prometheus:v2.21.0
        ports:
        - containerPort: 9090
        volumeMounts:
        #volume mount for prometheus config
          - name: prom-config
            mountPath: "/etc/prometheus"
            readOnly: true
      volumes:
        - name: prom-config
          configMap:
            name: prom-configmap
            items:
              - key: "prometheus.yml"
                path: "prometheus.yml"
#...
The purpose of this article is to present the potential offered by monitoring and therefore the one presented is a minimal architecture that shows the main features. The architecture can be considered a good start for test environments however for production I suggest using solutions that also add scalability and high reliability.
Installation
kubectl apply -f database-config.yaml
kubectl apply -f database.yaml
kubectl apply -f application-event.yaml
kubectl apply -f application-reservation.yaml
kubectl apply -f application-frontend.yaml
kubectl apply -f monitoring.yaml
Remember that we added readiness probe so the application layer will be considered ready when the database startup will be completed.
To inspect what we created run the following command:
> kubectl get pod,deployment,service,cm,secret
NAME                                         READY   STATUS    RESTARTS   AGE
pod/grafana-bc786c6f7-l67xz                  1/1     Running   0          3m9s
pod/mysql-7c69c955f6-d8cv2                   1/1     Running   1          3m16s
pod/prometheus-565766b796-t5whn              1/1     Running   0          3m9s
pod/starevent-event-9dc886949-sb6vl          1/1     Running   0          3m15s
pod/starevent-frontend-6d578f6f77-9q4c7      1/1     Running   0          3m13s
pod/starevent-reservation-7db8fbfb6b-4phh5   1/1     Running   0          3m14s

NAME                                    READY   UP-TO-DATE   AVAILABLE   AGE
deployment.apps/grafana                 1/1     1            1           3m9s
deployment.apps/mysql                   1/1     1            1           3m16s
deployment.apps/prometheus              1/1     1            1           3m9s
deployment.apps/starevent-event         1/1     1            1           3m15s
deployment.apps/starevent-frontend      1/1     1            1           3m13s
deployment.apps/starevent-reservation   1/1     1            1           3m14s

NAME                            TYPE        CLUSTER-IP       EXTERNAL-IP   PORT(S)    AGE
service/grafana                 ClusterIP   10.106.217.242   <none>        3000/TCP   3m9s
service/kubernetes              ClusterIP   10.96.0.1        <none>        443/TCP    4d19h
service/prometheus              ClusterIP   10.111.114.20    <none>        9090/TCP   3m9s
service/starevent-db            ClusterIP   10.107.108.20    <none>        3306/TCP   3m16s
service/starevent-event         ClusterIP   10.101.110.198   <none>        8081/TCP   3m15s
service/starevent-frontend      ClusterIP   10.102.135.69    <none>        8080/TCP   3m13s
service/starevent-reservation   ClusterIP   10.107.39.71     <none>        8082/TCP   3m14s

NAME                          DATA   AGE
configmap/grafana-configmap   1      3m10s
configmap/mysql-configmap     1      3m18s
configmap/prom-configmap      1      3m10s

NAME                         TYPE                                  DATA   AGE
secret/mysql-secret          Opaque                                3      3m18s
Notice that we can see all the Kubernetes object of the architecture.
If you want to navigate the application using the frontend:
kubectl port-forward service/starevent-frontend 8080and open a page from the browser http://127.0.0.1:8080
Let’s show the Prometheus UI, forwarding its service:
kubectl port-forward service/prometheus 9090and open a page from the browser http://127.0.0.1:9090
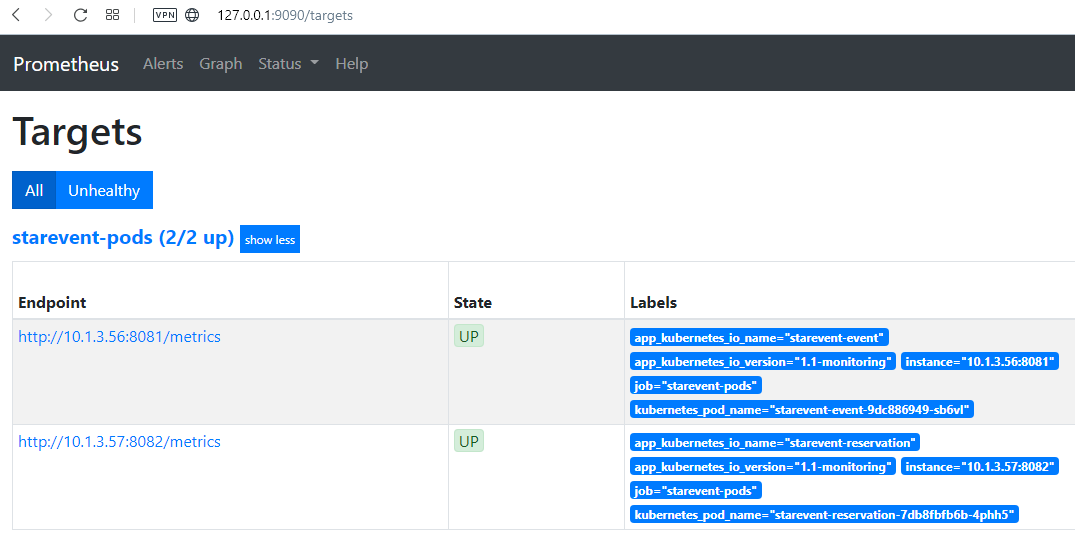
We can notice that there are two targets one for event service and another for reservation service. It is also possible to notice the labels that we exported from Kubernetes pod. Thanks to our configuration, Prometheus is able to follow the Kubernetes status and update the pods that are running our services.
What happens in case of a scale event? Let’s simulate a scale up event:
kubectl scale deployment/starevent-event --replicas=5If we update the Promethus target page:
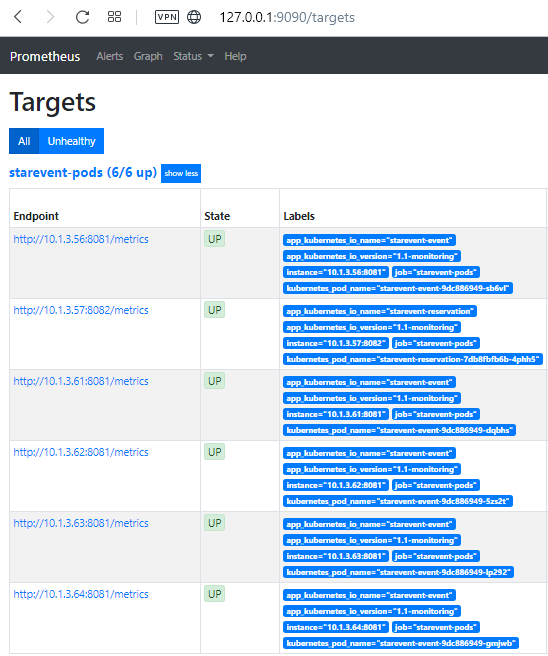
Notice that the targets are 6, 5 for event services and 1 for the reservation service.
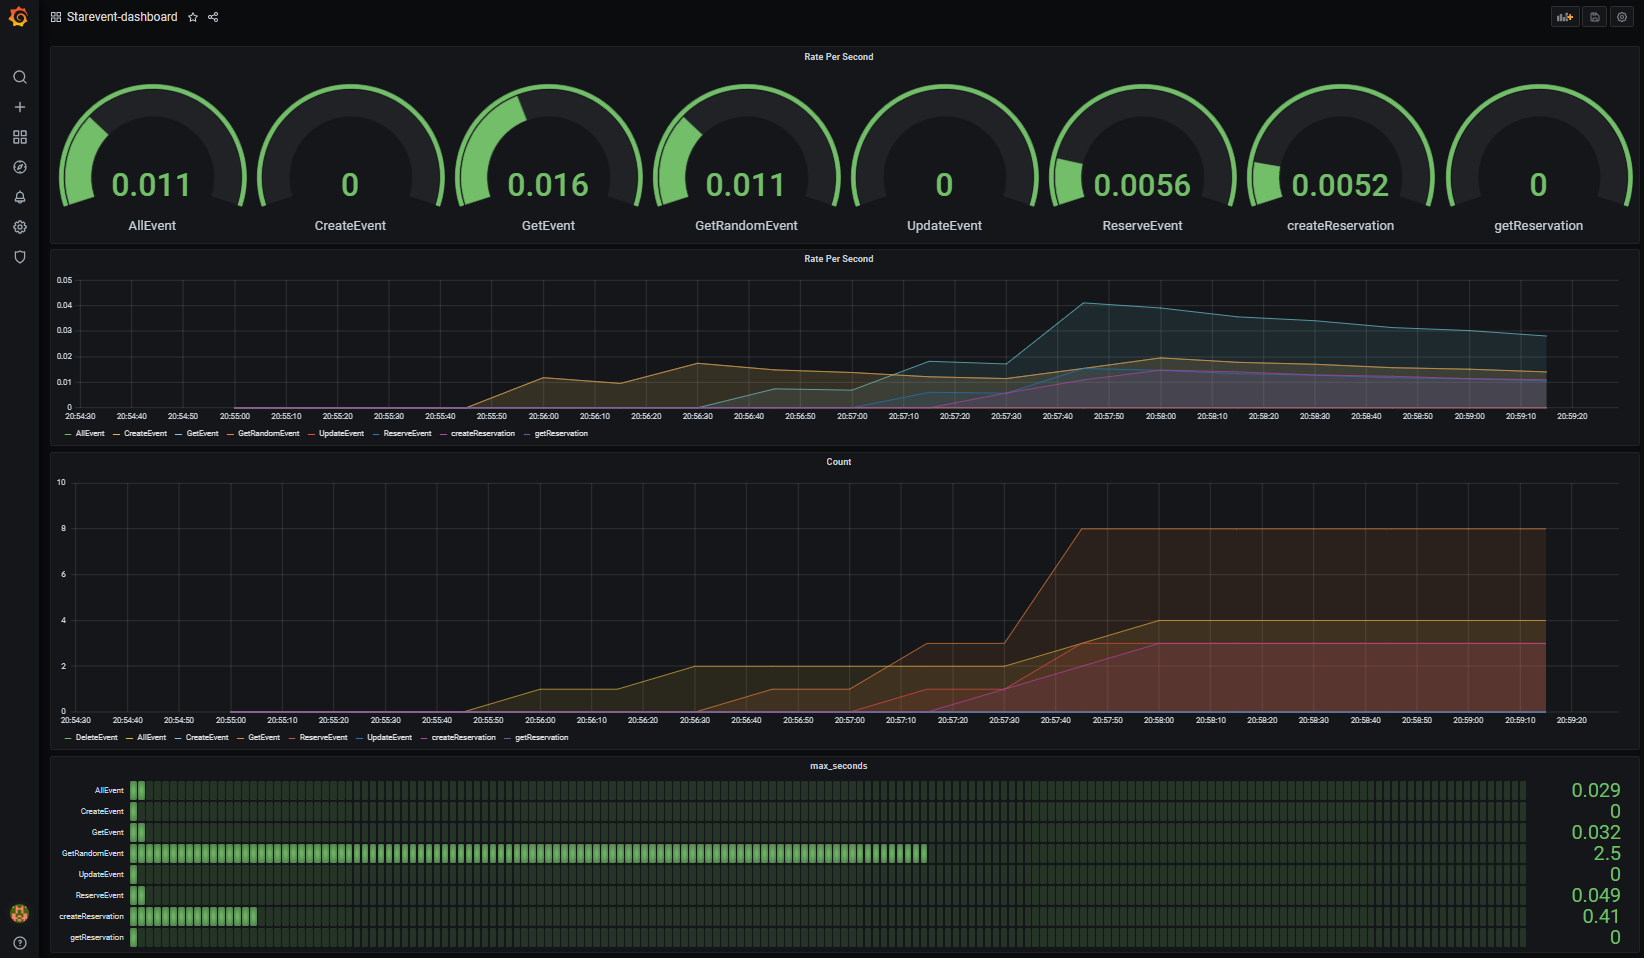
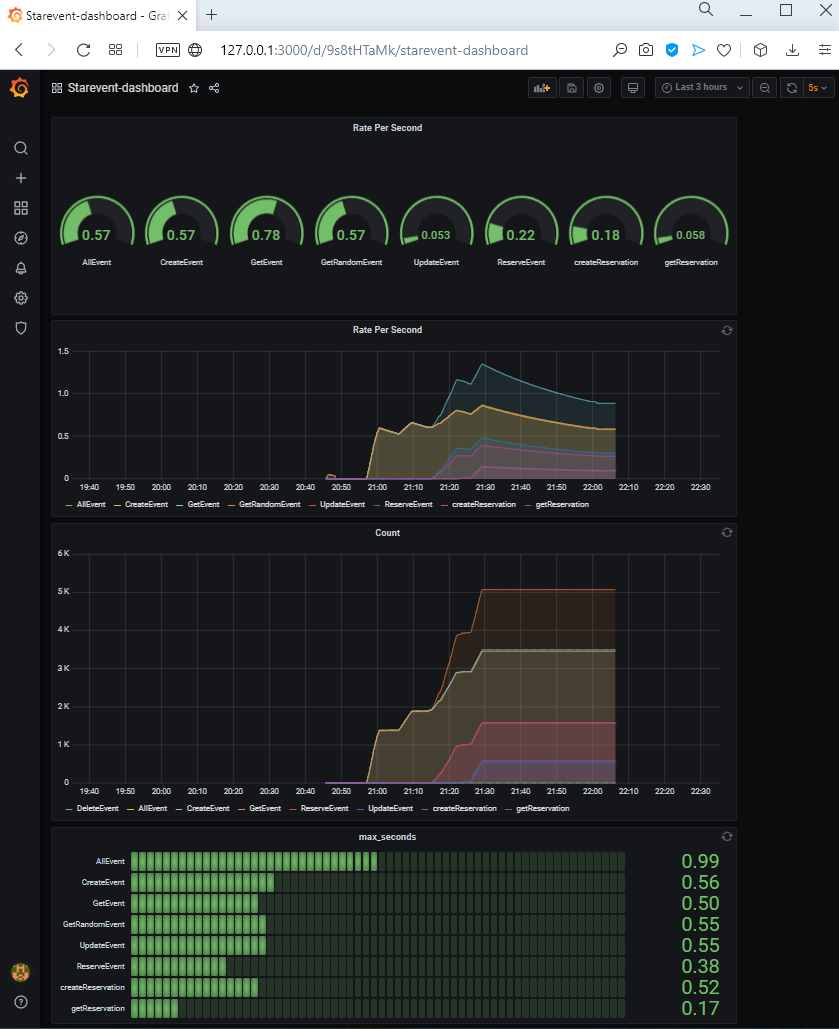
If are now interested on the application metrics we need to connect to the Grafana service:
kubectl port-forward service/grafana 3000and open a page from the browser http://127.0.0.1:3000
To see some data in graphics, I decided to create a simple jmeter load test to inject traffic into the system. You can find the source of jmeter file here: JMeter load test
Clean up
When we finish to play with the architecture, we can clean everything and release the created resources:
kubectl delete -f monitoring.yaml
kubectl delete -f application-frontend.yaml
kubectl delete -f application-reservation.yaml
kubectl delete -f application-event.yaml
kubectl delete -f database.yaml
kubectl delete -f database-config.yaml
Conclusion
This article extended the “startevent” application proposed in the previous article by adding access to the database and monitoring. The final purpose was to show the potential offered by quarkus with the aim of releasing the application in Kubernetes. In conclusion, also from this experience it emerges that Quarkus provides excellent support to the needs of the cloud and thanks to its extensions it allows to solve the problems of database access and monitoring with extreme ease. What emerges is that Quarkus is the result of the expertise, ideas and experience of the community that maintains and develops it. By leveraging the open source ecosystem, you can create applications that integrate easily with other systems and help release value.
Resources
If you want to learn more: